How To
How to create a pivot table in Excel
- September 21, 2022
- Updated: July 2, 2025 at 3:26 AM
At a glance, Microsoft Excel often seems very simple. However, there are a lot of hidden tips and tricks that make this program very versatile. A pivot table in Excel is one of the most powerful techniques to know about. Once you understand how a pivot table on Excel works, you are able to easily analyze, sort, and summarize huge amounts of data.
Ready to give it a try? Check out our pivot table how-to guide to learn all the details.
Enter your basic data to get started
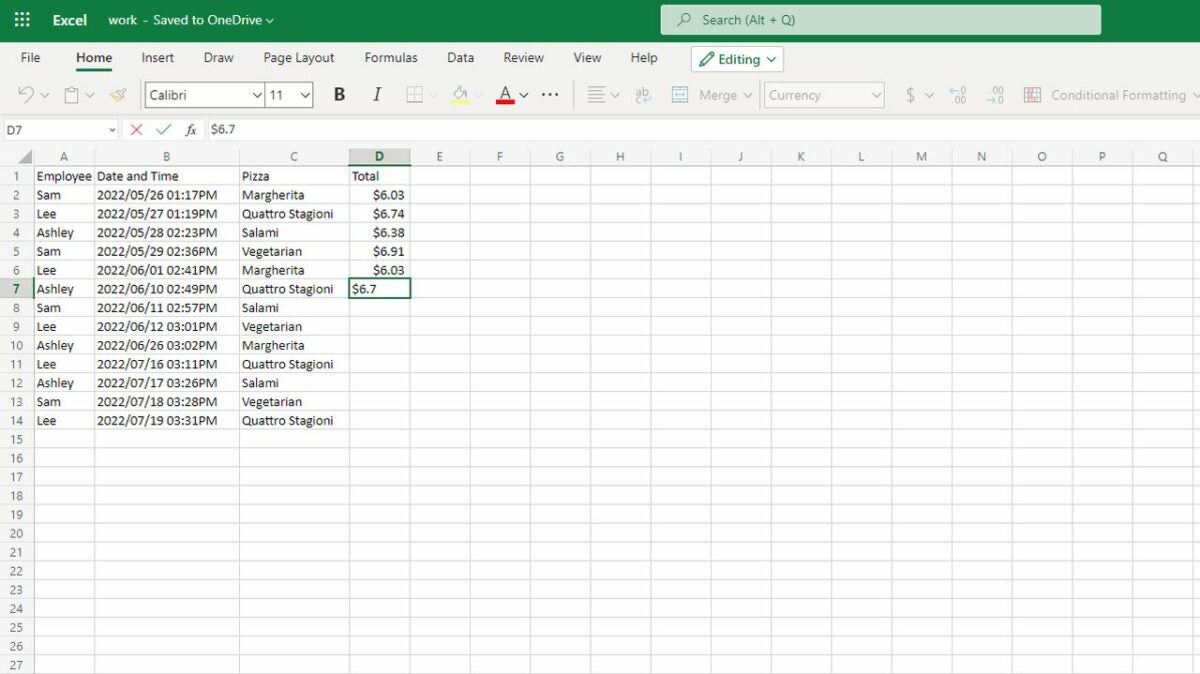
The first step in any pivot table how-to is entering your data. The method of entry will depend on your situation. Some users will simply type all their data in manually. If you have an existing document, you also have the option of using the File and Open tabs to upload a document. For ease of use, ensure the first row or column of your data has labels that explain what the data is. For example, if you’re tracking employee sales at your pizza restaurant, make sure you have an “Employee name” label above where you list each name.
Highlight your cells and open the pivot table creation box
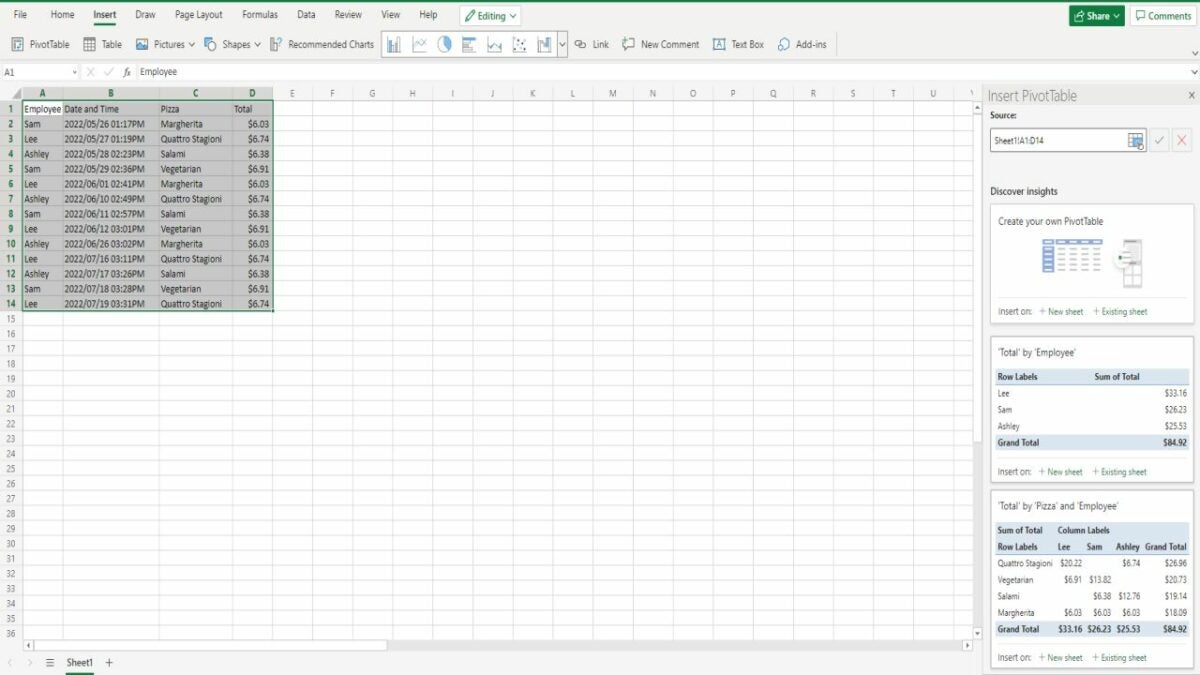
Use your mouse or keyboard keys to highlight the complete range of cells you want to turn into a pivot table. Then go to the Insert tab at the top of the page and click the PivotTable icon. This opens up a whole option box on the side of your Excel document. Your first option will be to create your own custom pivot table with all your own desired parameters. However, scrolling down will show a whole list of recommended pivot tables. They aren’t always useful, but it’s worthwhile to check them out. There’s a chance the recommended pivot table will have everything you need.
Whatever option you choose, you’ll be able to pick between launching your new table on your current sheet or on a new sheet.
Choose how you want your data arranged
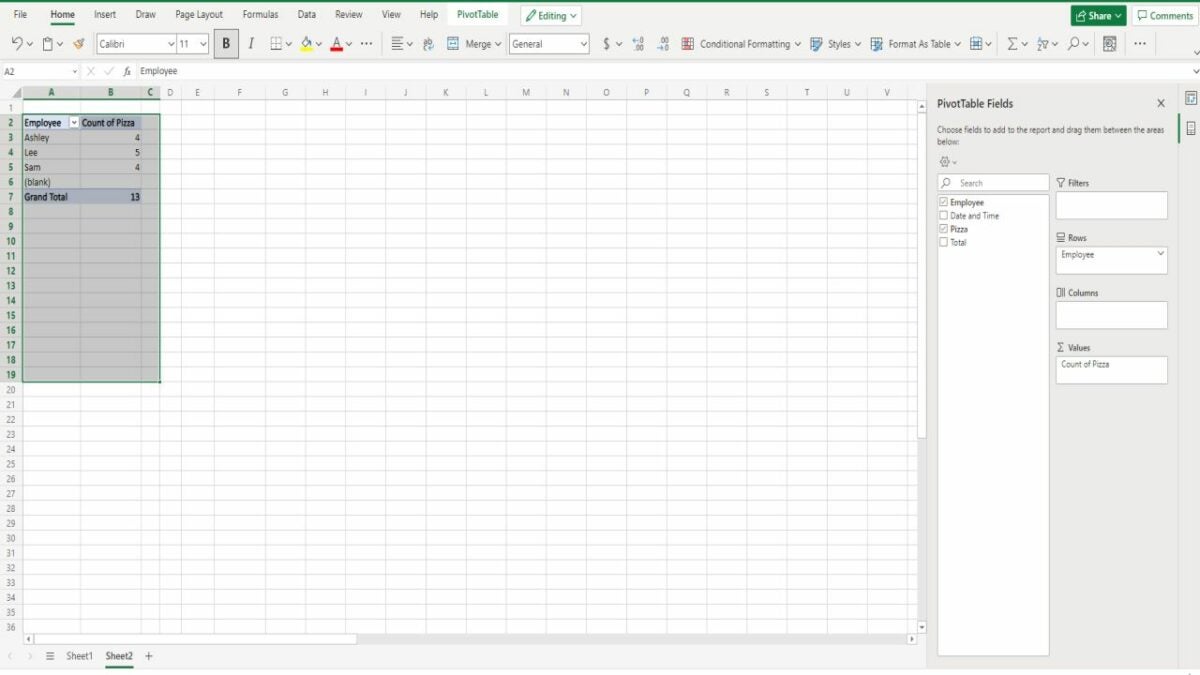
Once you create the pivot table, you have many different ways of looking at your data. You’re able to select one of your labeled fields as either the new column or row label by dragging the label to the Rows or Columns section. Another very helpful arrangement is dragging your fields into the Values section. This allows you to count and summarize large amounts of data. For example, dragging “Employee” into the Rows section and “Pizza” into the Values section tells you how many pizzas each employee sold.
Alter settings to get even more nuanced pivot tables in Excel
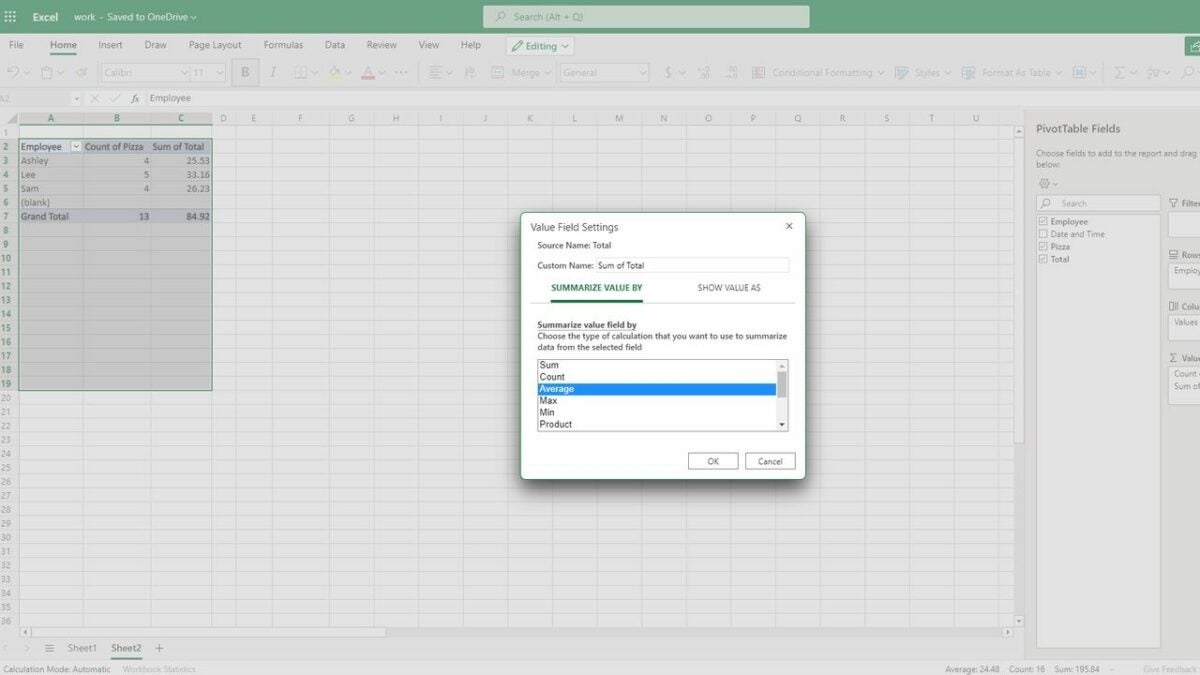
The Values section is one of the most useful parts of a pivot table in Excel. Once you drag and drop a field into the values area, you have the option of hovering over the field and clicking a drop-down menu. Selecting the Value Field Settings allows you to adjust how your data is calculated. Excel defaults to adding your numbers together, but it will also perform other calculations. It will do things like rank from largest to smallest. So for our pizza example, we would use the settings to find the average amount each employee makes for each sale.
Learn how to navigate between various types of pivot tables in Excel
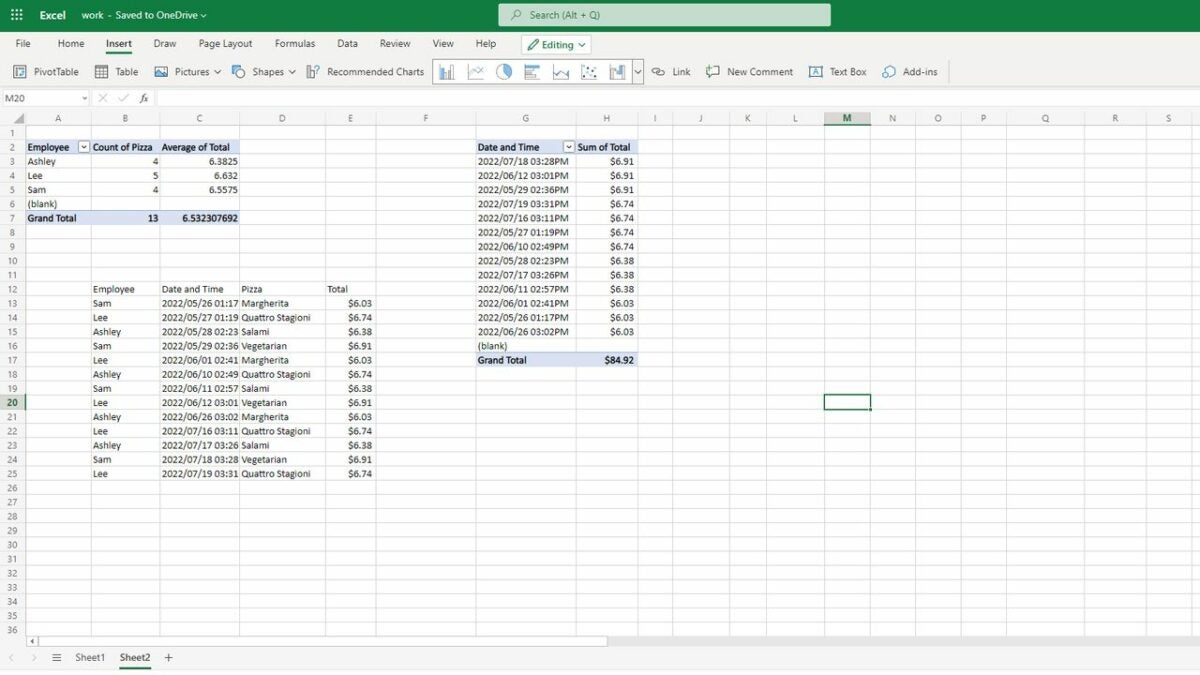
Once you’ve figured out the basics of creating a pivot table in Excel, the only thing left to do is integrate it into the rest of your spreadsheet. You are able to close the pivot table option box by clicking on any blank cell or reopen it by clicking on the existing pivot table. Excel always saves all data associated with that table, so you have the option of going back to the table and adjusting it to show previously hidden data. You also have the option of adding multiple pivot tables to a single document or adding plain data to another area of the document.
Final thoughts on Excel pivot tables
Ultimately, when it comes to pivot tables in Excel, your options are almost endless. Now that our pivot table Excel tutorial has explained the essentials, we suggest playing around with Excel yourself. You’ll find that there are countless interesting applications for a pivot table in Excel. We also have plenty of fantastic Excel tutorials, so check them out if you have any other questions about working with the program.

You may also like
 News
NewsThis incredible RPG and 4 other titles have their days numbered on Xbox Game Pass
Read more
 News
NewsIf you like the cutest character from Nintendo, get ready, because tomorrow there will be a Direct about his next game!
Read more
 News
NewsThe Pokémon Pocket Collectible Card Game will arrive in the fall… and with mega-evolved news!
Read more
 News
NewsAlthough it is not what fans were asking for, Shenmue will have an enhanced version of its third installment
Read more
 News
NewsThe producer of Battlefield 6 responds to the harsh criticism about the beta
Read more
 News
NewsThis movie has managed to dethrone The K-Pop Warriors as the most watched on Netflix
Read more